Browse By Unit
Jeanne Stansak
Jeanne Stansak
Measuring Change in the Economy
In unit 2, we've looked at a few major measures of economic activity. Most notably, we discussed Gross Domestic Product, unemployment, and inflation. However, we haven't looked at how we actually use these measures in tandem with each other over time to understand where the economy is and what its health is. As we'll discuss in this guide, the economy is cyclical, meaning that fluctuations in economic measures cycle over time. The cyclical pattern of expansion and recession of the economy over time is called the Business Cycle.
The Parts of the Business Cycle
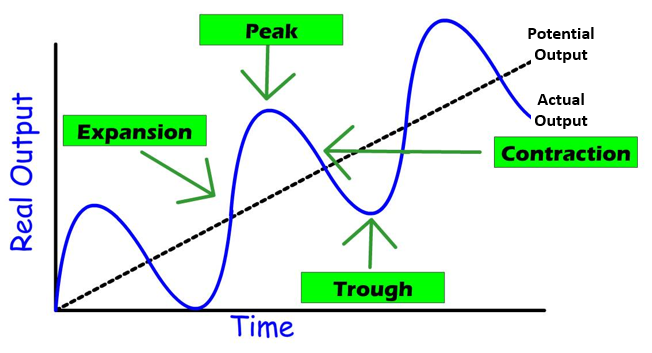
The business cycle can be viewed by graphing real GDP, a measure of productivity, over time:

Let's break down what each of the pieces of one period of the business cycle are:
Expansion + Peak
The business cycle starts with an expansionary phase, where the economy is growing in the short run. During this phase, unemployment is typically very low and inflation is rising. This expansionary phase may also be known as an inflationary gap, because of the positive gap between actual output and potential, long-run equilibrium output. The growth trend line represents the natural rate of real GDP growth over time that the economy hopes to maintain. It also represents a natural and healthy rate of inflation over time. At the growth trend line, the economy is experiencing full employment and meeting each of its goals which include promoting economic growth, preventing unemployment, and limiting inflation (keeping prices stable). Eventually, the growth slows until the economy reaches a peak.
Contraction + Trough
After the economy peaks, it begins contracting. A contractionary period is a period in which the economy is shrinking. This is accompanied with high unemployment and low inflation. A recession is defined as a period of two straight fiscal quarters (6 months) of negative GDP growth. A recession can develop into a depression, which is a particularly severe and long depression. For example, a typical recession may see unemployment hover between 7-9%, the Great Depression saw unemployment rates of upwards of 25%. Eventually, the economy reaches a trough and begins expanding again.
The Business Cycle in Real Life
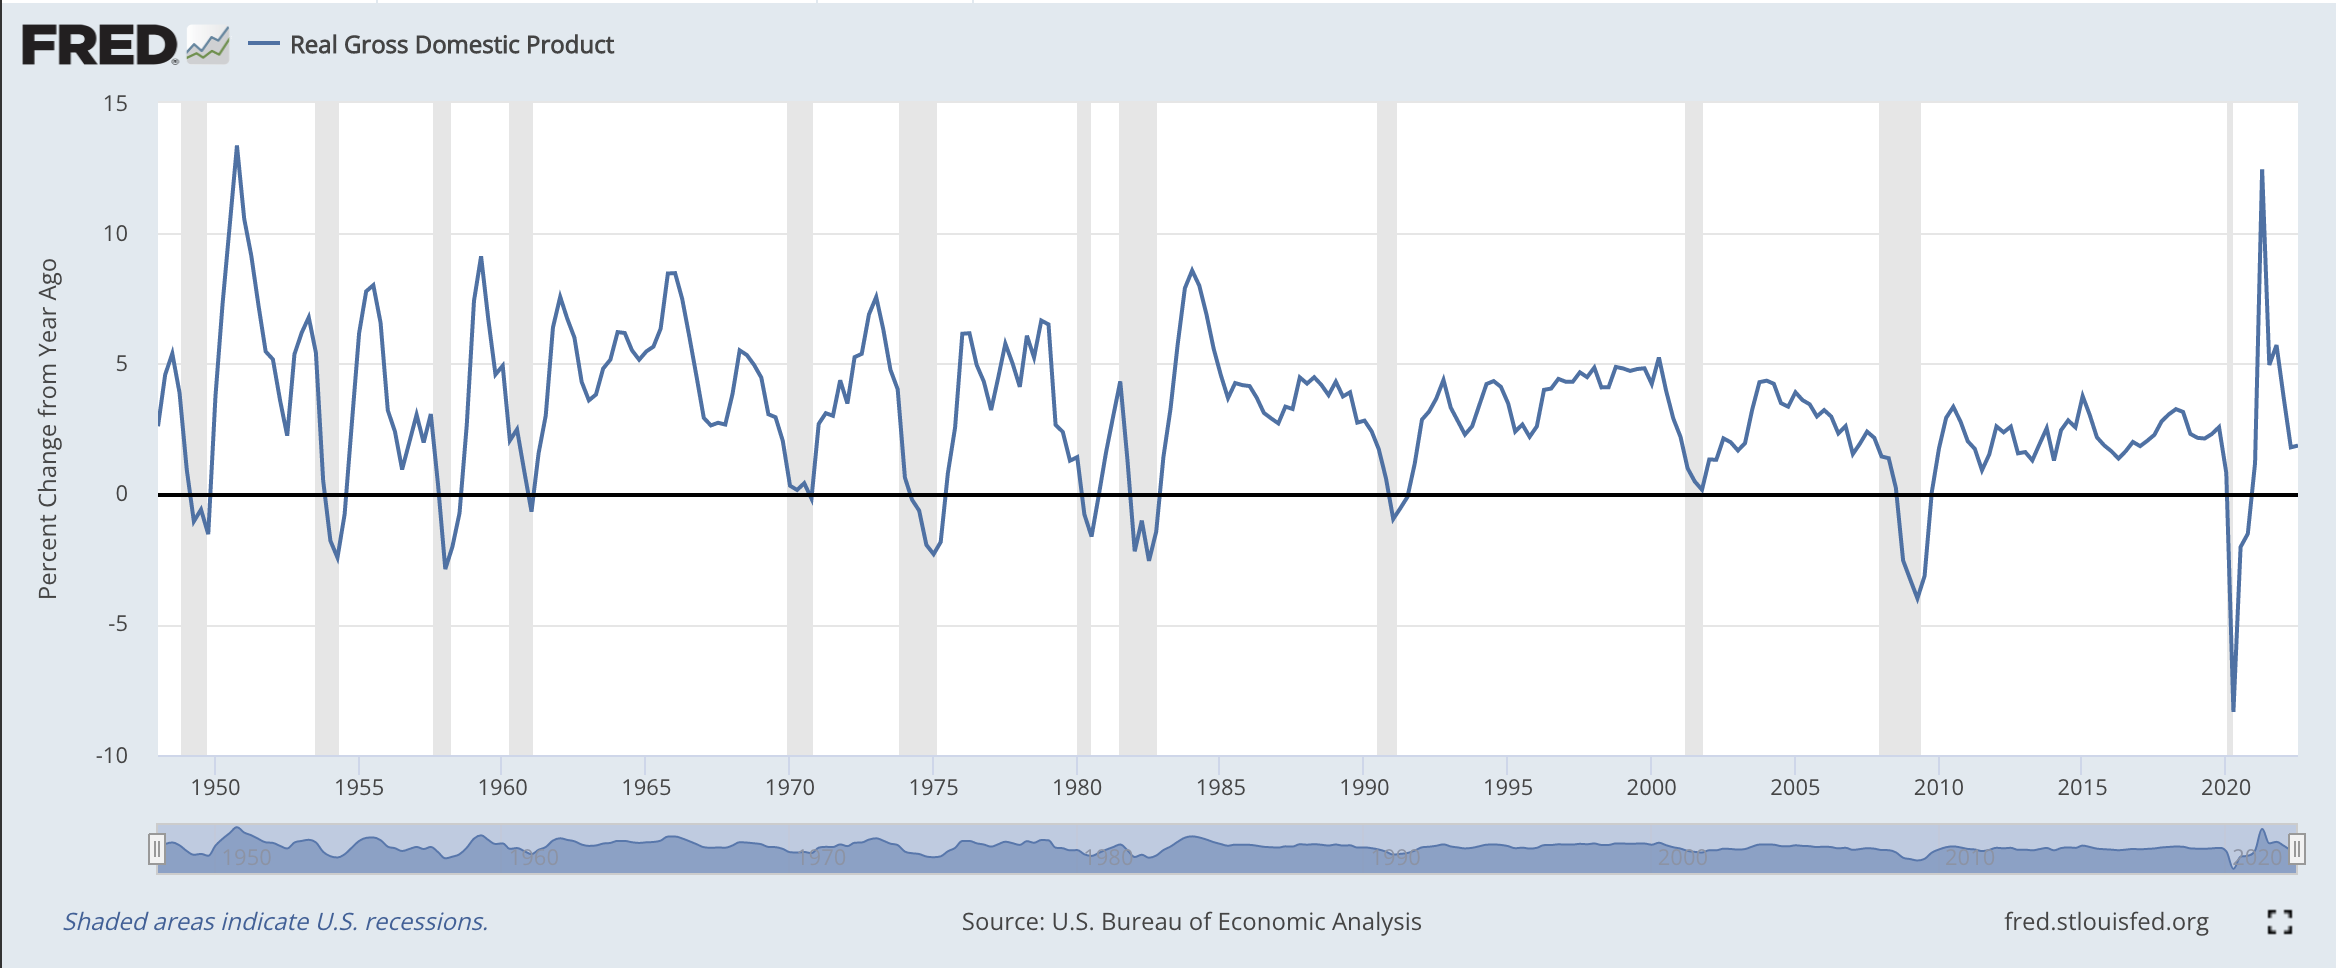
While we've discussed the business cycle in a theoretical sense, we can also observe business cycles in real life data. Take a look at this graph of real GDP growth over time in the United States.

Source: FRED (Federal Reserve Economic Data)
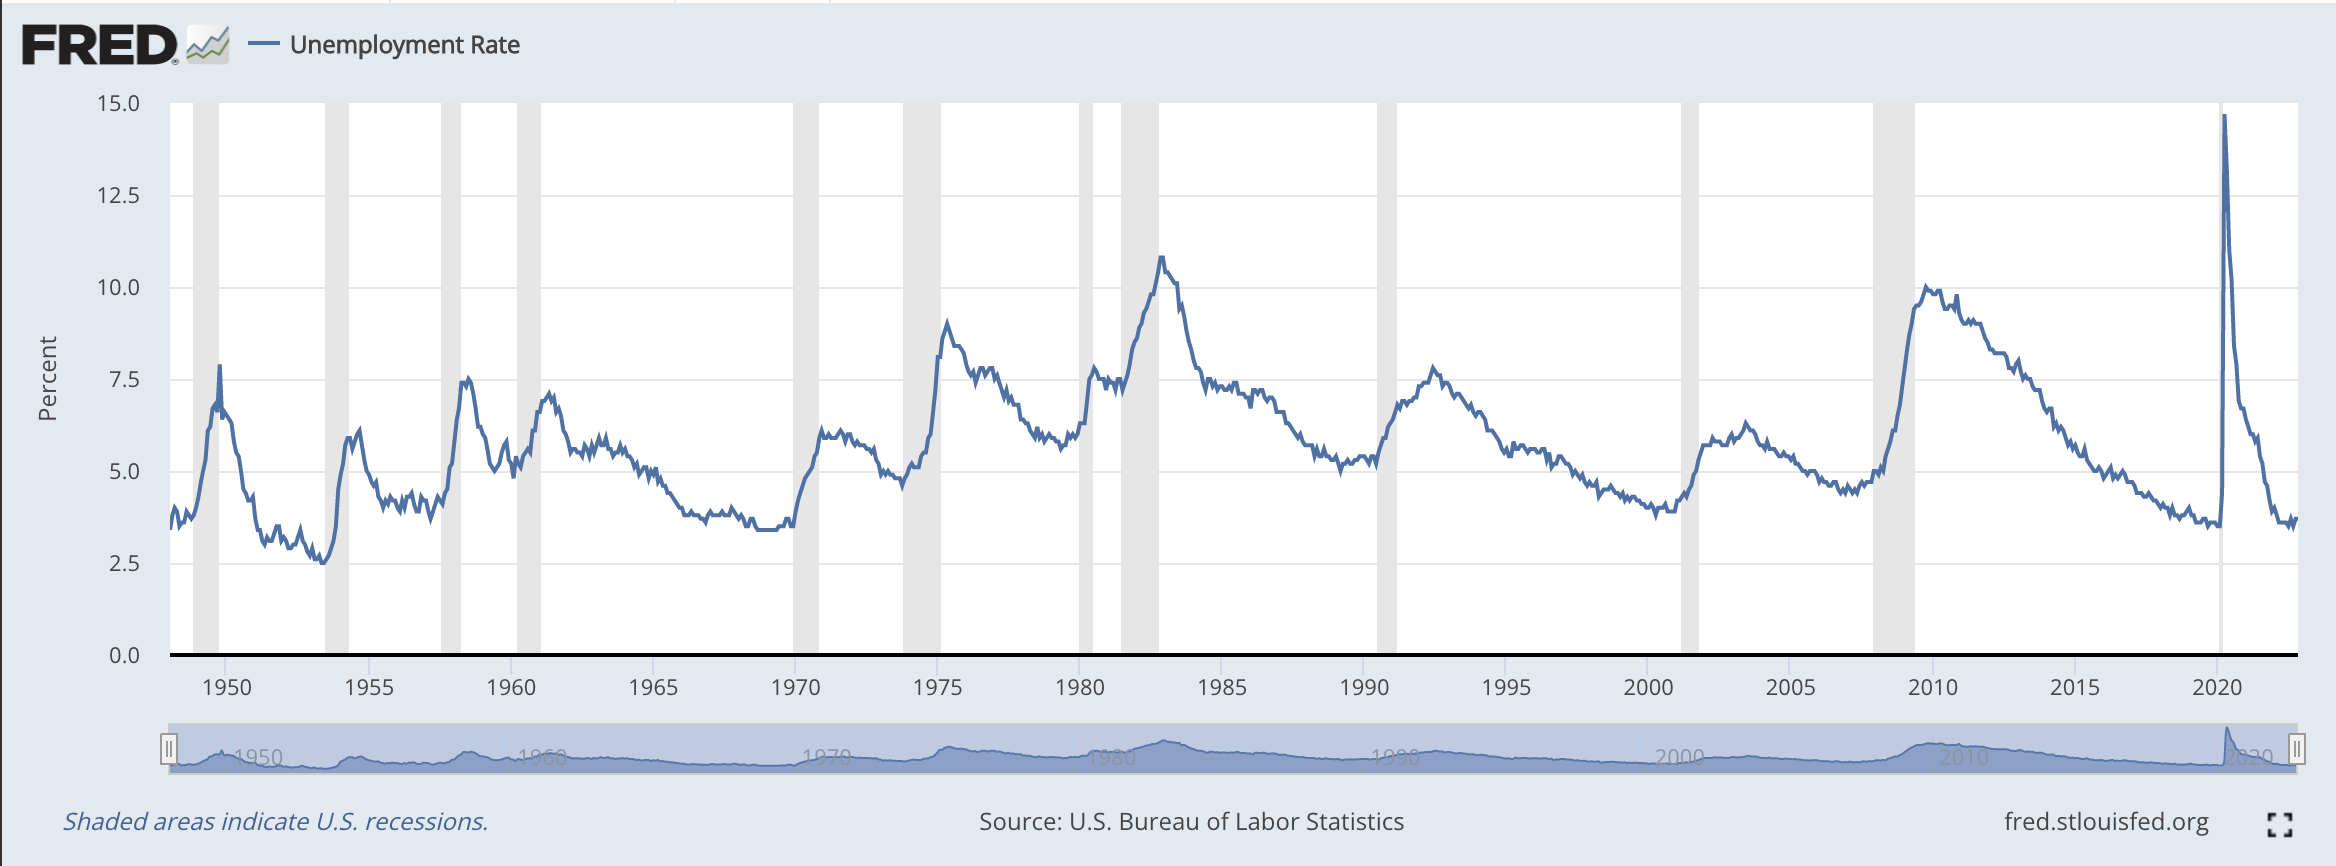
In this graph, the grey areas are recessions. As you can see, the economy is relatively cyclical, but the time between recessions is more variable. Here's a similar graph of the unemployment rate over time:

This graph similarly shows the cyclical nature of the economy. In recessions, unemployment rises, and steadily decreases in expansionary phases.
<< Hide Menu
Jeanne Stansak
Jeanne Stansak
Measuring Change in the Economy
In unit 2, we've looked at a few major measures of economic activity. Most notably, we discussed Gross Domestic Product, unemployment, and inflation. However, we haven't looked at how we actually use these measures in tandem with each other over time to understand where the economy is and what its health is. As we'll discuss in this guide, the economy is cyclical, meaning that fluctuations in economic measures cycle over time. The cyclical pattern of expansion and recession of the economy over time is called the Business Cycle.
The Parts of the Business Cycle
The business cycle can be viewed by graphing real GDP, a measure of productivity, over time:

Let's break down what each of the pieces of one period of the business cycle are:
Expansion + Peak
The business cycle starts with an expansionary phase, where the economy is growing in the short run. During this phase, unemployment is typically very low and inflation is rising. This expansionary phase may also be known as an inflationary gap, because of the positive gap between actual output and potential, long-run equilibrium output. The growth trend line represents the natural rate of real GDP growth over time that the economy hopes to maintain. It also represents a natural and healthy rate of inflation over time. At the growth trend line, the economy is experiencing full employment and meeting each of its goals which include promoting economic growth, preventing unemployment, and limiting inflation (keeping prices stable). Eventually, the growth slows until the economy reaches a peak.
Contraction + Trough
After the economy peaks, it begins contracting. A contractionary period is a period in which the economy is shrinking. This is accompanied with high unemployment and low inflation. A recession is defined as a period of two straight fiscal quarters (6 months) of negative GDP growth. A recession can develop into a depression, which is a particularly severe and long depression. For example, a typical recession may see unemployment hover between 7-9%, the Great Depression saw unemployment rates of upwards of 25%. Eventually, the economy reaches a trough and begins expanding again.
The Business Cycle in Real Life
While we've discussed the business cycle in a theoretical sense, we can also observe business cycles in real life data. Take a look at this graph of real GDP growth over time in the United States.

Source: FRED (Federal Reserve Economic Data)
In this graph, the grey areas are recessions. As you can see, the economy is relatively cyclical, but the time between recessions is more variable. Here's a similar graph of the unemployment rate over time:

This graph similarly shows the cyclical nature of the economy. In recessions, unemployment rises, and steadily decreases in expansionary phases.

© 2024 Fiveable Inc. All rights reserved.