Browse By Unit
Jeanne Stansak
Isabela Padilha
Jeanne Stansak
Isabela Padilha
Unit 1 - Demand
Definition of Demand
Demand is defined as the different quantities of goods and services that consumers are willing and able to purchase at various price levels.
Demand vs. Quantity Demanded
Quantity demanded is a the amount of a good or service that is desired at a particular price level.
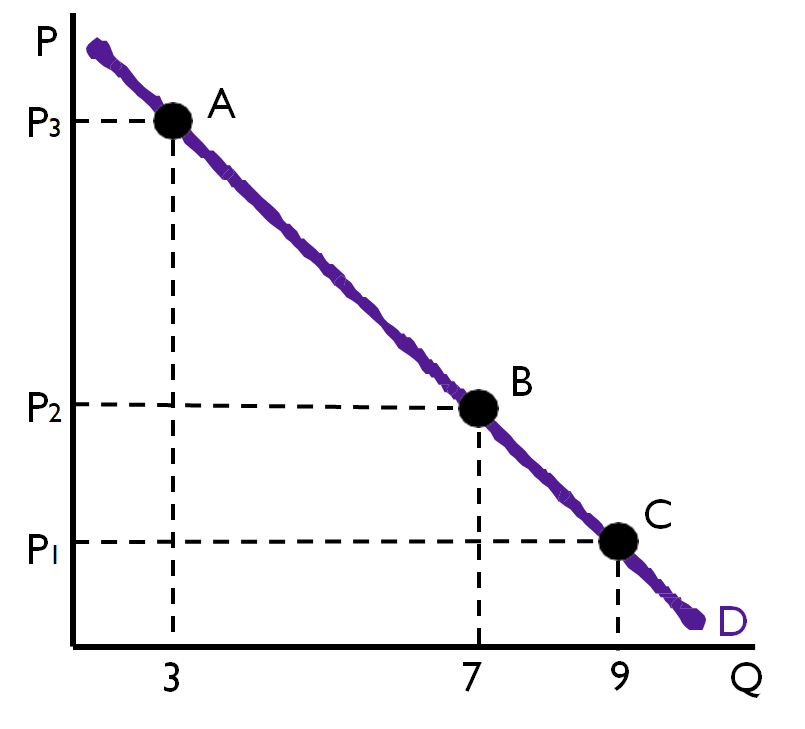
Below is a demand curve, quantity demanded is one point on the curve (i.e. A, B, or C) and Demand is the entire line with all of the points that make it up.

Law of Demand
The law of demand states that the relationship between the price level and the quantity demanded of a good or service is inverse. As the price level rises, consumers are less willing or less able to purchase the same quantity, and, therefore, buy less. As the price level falls, consumers are more willing or more able to purchase a greater quantity, and, therefore, buy more.
In summary:
- When price level increases ⬆️, the quantity of a good demanded decreases ⬇️.
- When price level decreases ⬇️, the quantity of a good demanded increases⬆️. Using the graph above, when the price rises from P1 to P2, the quantity demanded decreases from 9 units to 7 units. Also, when the price drops from P3 to P2, the quantity demanded increases from 3 units to 7 units.
💡The only thing that changes the quantity demanded is the price of the good or service.
Let's take a look at another graph:

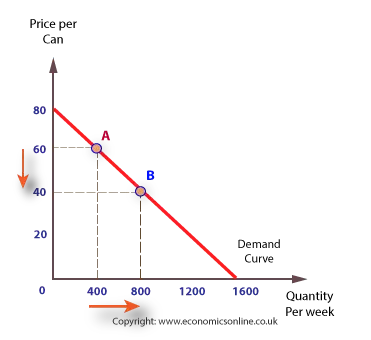
It is possible to observe at point 🅱️ that the quantity is 800, while the "price per can" is $40.
But, if the price increases from 60 as observed by point 🅰️, the quantity of cans demanded decreases to 400.
Therefore, price level and quantity demanded are inversely related.
Determinants of Demand
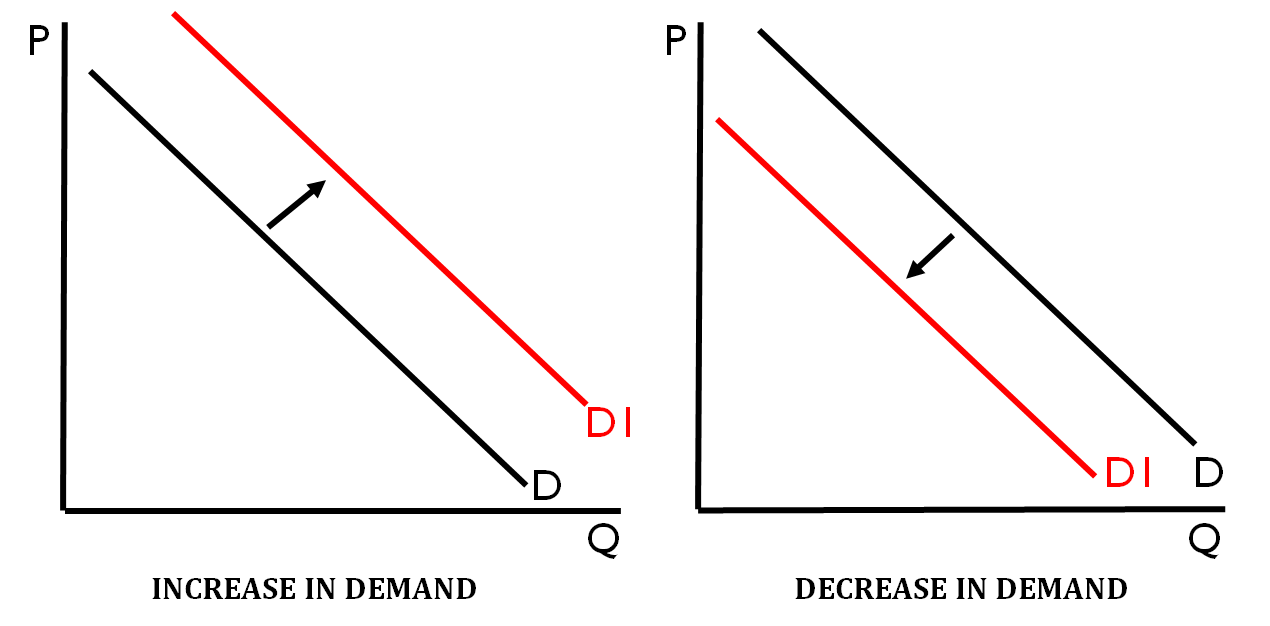
Determinants are factors that can cause the entire demand curve to increase or decrease (shift to the right or shift to the left). When there is an increase in demand (see graph below), the demand curve will shift right. At every price level, there is an increase in the quantity demanded. When there is a decrease in demand (see graph below), the demand curve will shift left. At every price level, there is a decrease in quantity demanded.

There are several determinants of demand that cause the shift to the right (increase in demand) or the shift to the left (decrease in demand). We are going to use the acronym I-N-S-E-C-T as a way to remember all of the determinants.
The INSECT Acronym
- I = Income
- N = Number of Buyers/Consumers
- S = Substitutes
- E = Expectations of Future Price
- C = Complements
- T = Tastes and Preferences
💡Complements are goods consumed together. This means that they have a joint demand.
Demand will increase (shift right) if:
- I = Income increases ⬆️
- N = Number of Buyers/Consumers increases ⬆️
- S = Substitutes' prices increase ⬆️
- E = Expectation of Future Price increases ⬆️
- C = Complements' prices decrease ⬇️
- T = Tastes and Preferences for that good increase (for example, through advertising!) ⬆️

Demand will decrease (shift left) if:
- I = Income decreases ⬇️
- N = Number of Buyers/Consumers decreases ⬇️
- S = Substitutes' prices decrease ⬇️
- E = Expectation of Future Price decreases ⬇️
- C = Complements' prices increases ⬆️
- T = Tastes and Preferences for that good decrease ⬇️
<< Hide Menu
Jeanne Stansak
Isabela Padilha
Jeanne Stansak
Isabela Padilha
Unit 1 - Demand
Definition of Demand
Demand is defined as the different quantities of goods and services that consumers are willing and able to purchase at various price levels.
Demand vs. Quantity Demanded
Quantity demanded is a the amount of a good or service that is desired at a particular price level.
Below is a demand curve, quantity demanded is one point on the curve (i.e. A, B, or C) and Demand is the entire line with all of the points that make it up.

Law of Demand
The law of demand states that the relationship between the price level and the quantity demanded of a good or service is inverse. As the price level rises, consumers are less willing or less able to purchase the same quantity, and, therefore, buy less. As the price level falls, consumers are more willing or more able to purchase a greater quantity, and, therefore, buy more.
In summary:
- When price level increases ⬆️, the quantity of a good demanded decreases ⬇️.
- When price level decreases ⬇️, the quantity of a good demanded increases⬆️. Using the graph above, when the price rises from P1 to P2, the quantity demanded decreases from 9 units to 7 units. Also, when the price drops from P3 to P2, the quantity demanded increases from 3 units to 7 units.
💡The only thing that changes the quantity demanded is the price of the good or service.
Let's take a look at another graph:

It is possible to observe at point 🅱️ that the quantity is 800, while the "price per can" is $40.
But, if the price increases from 60 as observed by point 🅰️, the quantity of cans demanded decreases to 400.
Therefore, price level and quantity demanded are inversely related.
Determinants of Demand
Determinants are factors that can cause the entire demand curve to increase or decrease (shift to the right or shift to the left). When there is an increase in demand (see graph below), the demand curve will shift right. At every price level, there is an increase in the quantity demanded. When there is a decrease in demand (see graph below), the demand curve will shift left. At every price level, there is a decrease in quantity demanded.

There are several determinants of demand that cause the shift to the right (increase in demand) or the shift to the left (decrease in demand). We are going to use the acronym I-N-S-E-C-T as a way to remember all of the determinants.
The INSECT Acronym
- I = Income
- N = Number of Buyers/Consumers
- S = Substitutes
- E = Expectations of Future Price
- C = Complements
- T = Tastes and Preferences
💡Complements are goods consumed together. This means that they have a joint demand.
Demand will increase (shift right) if:
- I = Income increases ⬆️
- N = Number of Buyers/Consumers increases ⬆️
- S = Substitutes' prices increase ⬆️
- E = Expectation of Future Price increases ⬆️
- C = Complements' prices decrease ⬇️
- T = Tastes and Preferences for that good increase (for example, through advertising!) ⬆️

Demand will decrease (shift left) if:
- I = Income decreases ⬇️
- N = Number of Buyers/Consumers decreases ⬇️
- S = Substitutes' prices decrease ⬇️
- E = Expectation of Future Price decreases ⬇️
- C = Complements' prices increases ⬆️
- T = Tastes and Preferences for that good decrease ⬇️

© 2024 Fiveable Inc. All rights reserved.