Browse By Unit
Introduction to Population & Migration
Today, there are over 7 billion people living on the planet! Although global birth rates are declining, there are more people in the world than ever before in human history. Despite improved living conditions and increased access to healthcare, the vast majority of people still live in low-income developing countries. In this unit, we will tackle a very simple, yet fascinating, question -- Why do people live where they do?
Unit Preview (Try to answer these questions!):
- Why are there so many people in China and India?
- What factors cause people to live in certain areas rather than others?
- Why do people move from place to place?
- Why do so many migrants come from Africa, the Middle East, and Asia?
- Why has the world population grown so rapidly in the last century?
- Why do migrants move to developed regions such as Europe or North America?
- How do density and spatial distribution affect where people live?
What determines where people live?
Physical Factors 🌄💪🌅
Take a moment to think about where you live. What makes a city or country a desirable (or undesirable) place to live? To answer this question, you might have thought about the climate of a region, the proximity of bodies of water, or even the location of major geographical landmarks such as mountain ranges.
People need food to survive, and thus we often see cities develop around fertile valleys and around rivers. Most people in the world live in midlatitudes (regions between 30°N and 60°N and between 30°S and 60°S). These areas have moderate climates and better soil that contribute to a desirable location to live.
Lastly, people want to live in low-lying areas rather than high in the mountains. Low-lying areas have better soils and are often located near oceans or other bodies of water. Freshwater (water without salt) also drives people to lake regions or rivers.
Human Factors 👦👧👴👵👲👳
Despite the appeal of physical factors, food and water alone are not enough to get people to move into an area. People in the modern world also seek safety, job opportunities, and proximity to relatives.
Types of Densities
Demographers study these three types of population density: Arithmetic, Physiological, and Agricultural population density.
Arithmetic population density: This type of density simply measures the average number of people in a given area. For example, the US has a total population of 330 million people spread out over 3,841,999 square miles. Thus, the arithmetic density is about 84 people per square mile.
Physiological population density: Unlike Arithmetic population density, this type of density is calculated by dividing the total population by the amount of arable land available. In other words, this is the number of people in a given area divided by the amount of land suitable for growing crops.
Agricultural population density: This last type of population density compares the number of farmers to the area of arable land. A smaller number of farmers in a given area most likely indicates a higher degree of efficiency because fewer people are required to make the same amount of food.
Population Pyramids ⟁
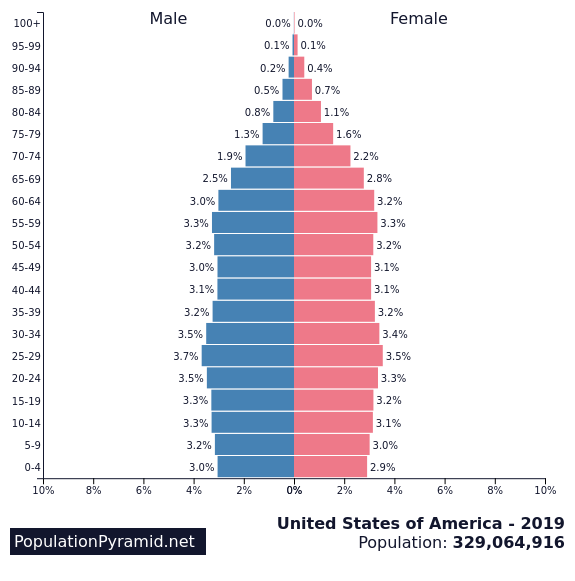
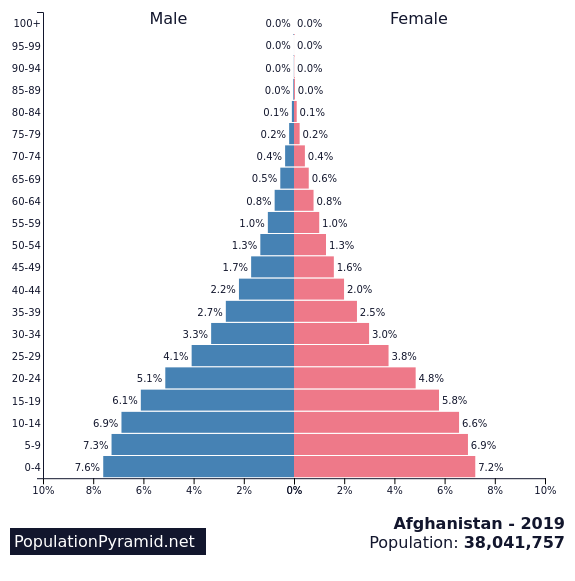
Population pyramids ⟁ show the distribution of people in a given country by age group and gender. Population pyramids can provide valuable information on birth rates, death rates, economic development, and education levels in a country. These pyramids are often questions on the exam so make sure you know how to read them and what each stage of the population looks like as a pyramid. Follow the link under the image and try out what different countries currently look like. It can be really interesting.


Images Courtesy of PopulationPyramid.net
Population Growth and Decline 📈👶📉
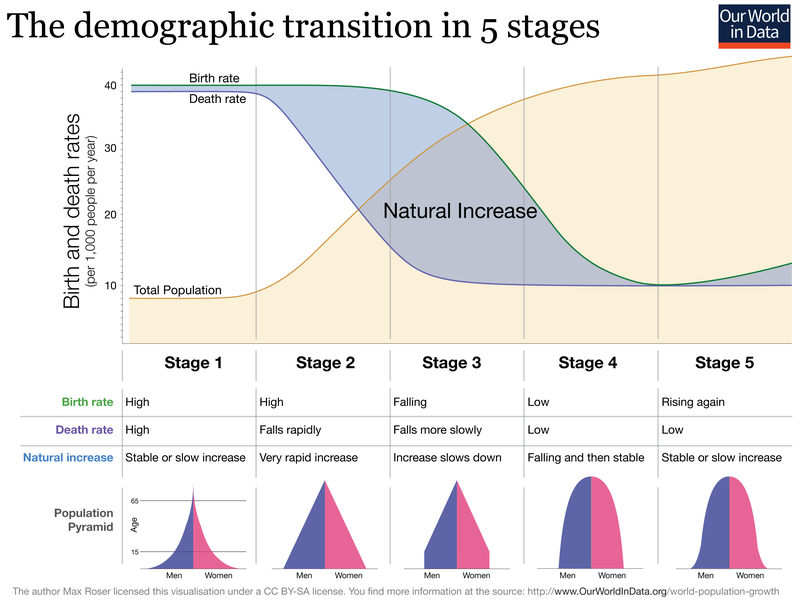
A country’s population will fluctuate wildly depending on a variety of different factors. The Demographic Transition Model (DTM) is the most important model of population growth and shifting rates of birth and death in a country. There are four main stages of the DTM, but recently there has been a shift towards a fifth stage. As a country modernizes, birth and death rates decline as a result of increased access to education and healthcare, larger food supplies, and overall economic growth. Make sure you understand these 5 stages! They are very helpful for the exam.

Image Courtesy of Wikipedia
📽️Watch: APHUG - The Demographic Transition
Why People Move 🏃
Push and Pull Factors
Push and pull factors are commonly used to describe why migrants move. Push factors are reasons why people leave their home country while pull factors are reasons why people are attracted to another country that they desire to move to. Wars, terrorist activity, poor economic conditions, and overpopulation are examples of common push factors. A desire to live with relatives in another region, new job opportunities and safe living conditions are pull factors that lure people into a new country.
📽️Watch: APHUG - Population Pyramids
📽️Watch: APHUG - Migration
<< Hide Menu
Introduction to Population & Migration
Today, there are over 7 billion people living on the planet! Although global birth rates are declining, there are more people in the world than ever before in human history. Despite improved living conditions and increased access to healthcare, the vast majority of people still live in low-income developing countries. In this unit, we will tackle a very simple, yet fascinating, question -- Why do people live where they do?
Unit Preview (Try to answer these questions!):
- Why are there so many people in China and India?
- What factors cause people to live in certain areas rather than others?
- Why do people move from place to place?
- Why do so many migrants come from Africa, the Middle East, and Asia?
- Why has the world population grown so rapidly in the last century?
- Why do migrants move to developed regions such as Europe or North America?
- How do density and spatial distribution affect where people live?
What determines where people live?
Physical Factors 🌄💪🌅
Take a moment to think about where you live. What makes a city or country a desirable (or undesirable) place to live? To answer this question, you might have thought about the climate of a region, the proximity of bodies of water, or even the location of major geographical landmarks such as mountain ranges.
People need food to survive, and thus we often see cities develop around fertile valleys and around rivers. Most people in the world live in midlatitudes (regions between 30°N and 60°N and between 30°S and 60°S). These areas have moderate climates and better soil that contribute to a desirable location to live.
Lastly, people want to live in low-lying areas rather than high in the mountains. Low-lying areas have better soils and are often located near oceans or other bodies of water. Freshwater (water without salt) also drives people to lake regions or rivers.
Human Factors 👦👧👴👵👲👳
Despite the appeal of physical factors, food and water alone are not enough to get people to move into an area. People in the modern world also seek safety, job opportunities, and proximity to relatives.
Types of Densities
Demographers study these three types of population density: Arithmetic, Physiological, and Agricultural population density.
Arithmetic population density: This type of density simply measures the average number of people in a given area. For example, the US has a total population of 330 million people spread out over 3,841,999 square miles. Thus, the arithmetic density is about 84 people per square mile.
Physiological population density: Unlike Arithmetic population density, this type of density is calculated by dividing the total population by the amount of arable land available. In other words, this is the number of people in a given area divided by the amount of land suitable for growing crops.
Agricultural population density: This last type of population density compares the number of farmers to the area of arable land. A smaller number of farmers in a given area most likely indicates a higher degree of efficiency because fewer people are required to make the same amount of food.
Population Pyramids ⟁
Population pyramids ⟁ show the distribution of people in a given country by age group and gender. Population pyramids can provide valuable information on birth rates, death rates, economic development, and education levels in a country. These pyramids are often questions on the exam so make sure you know how to read them and what each stage of the population looks like as a pyramid. Follow the link under the image and try out what different countries currently look like. It can be really interesting.


Images Courtesy of PopulationPyramid.net
Population Growth and Decline 📈👶📉
A country’s population will fluctuate wildly depending on a variety of different factors. The Demographic Transition Model (DTM) is the most important model of population growth and shifting rates of birth and death in a country. There are four main stages of the DTM, but recently there has been a shift towards a fifth stage. As a country modernizes, birth and death rates decline as a result of increased access to education and healthcare, larger food supplies, and overall economic growth. Make sure you understand these 5 stages! They are very helpful for the exam.

Image Courtesy of Wikipedia
📽️Watch: APHUG - The Demographic Transition
Why People Move 🏃
Push and Pull Factors
Push and pull factors are commonly used to describe why migrants move. Push factors are reasons why people leave their home country while pull factors are reasons why people are attracted to another country that they desire to move to. Wars, terrorist activity, poor economic conditions, and overpopulation are examples of common push factors. A desire to live with relatives in another region, new job opportunities and safe living conditions are pull factors that lure people into a new country.
📽️Watch: APHUG - Population Pyramids
📽️Watch: APHUG - Migration

© 2025 Fiveable Inc. All rights reserved.